Mysuper dashboard

Use the MySuper dashboard to compare the BUSSQ MySuper product with
other MySuper products.
BUSSQ MySuper Product Dashboard
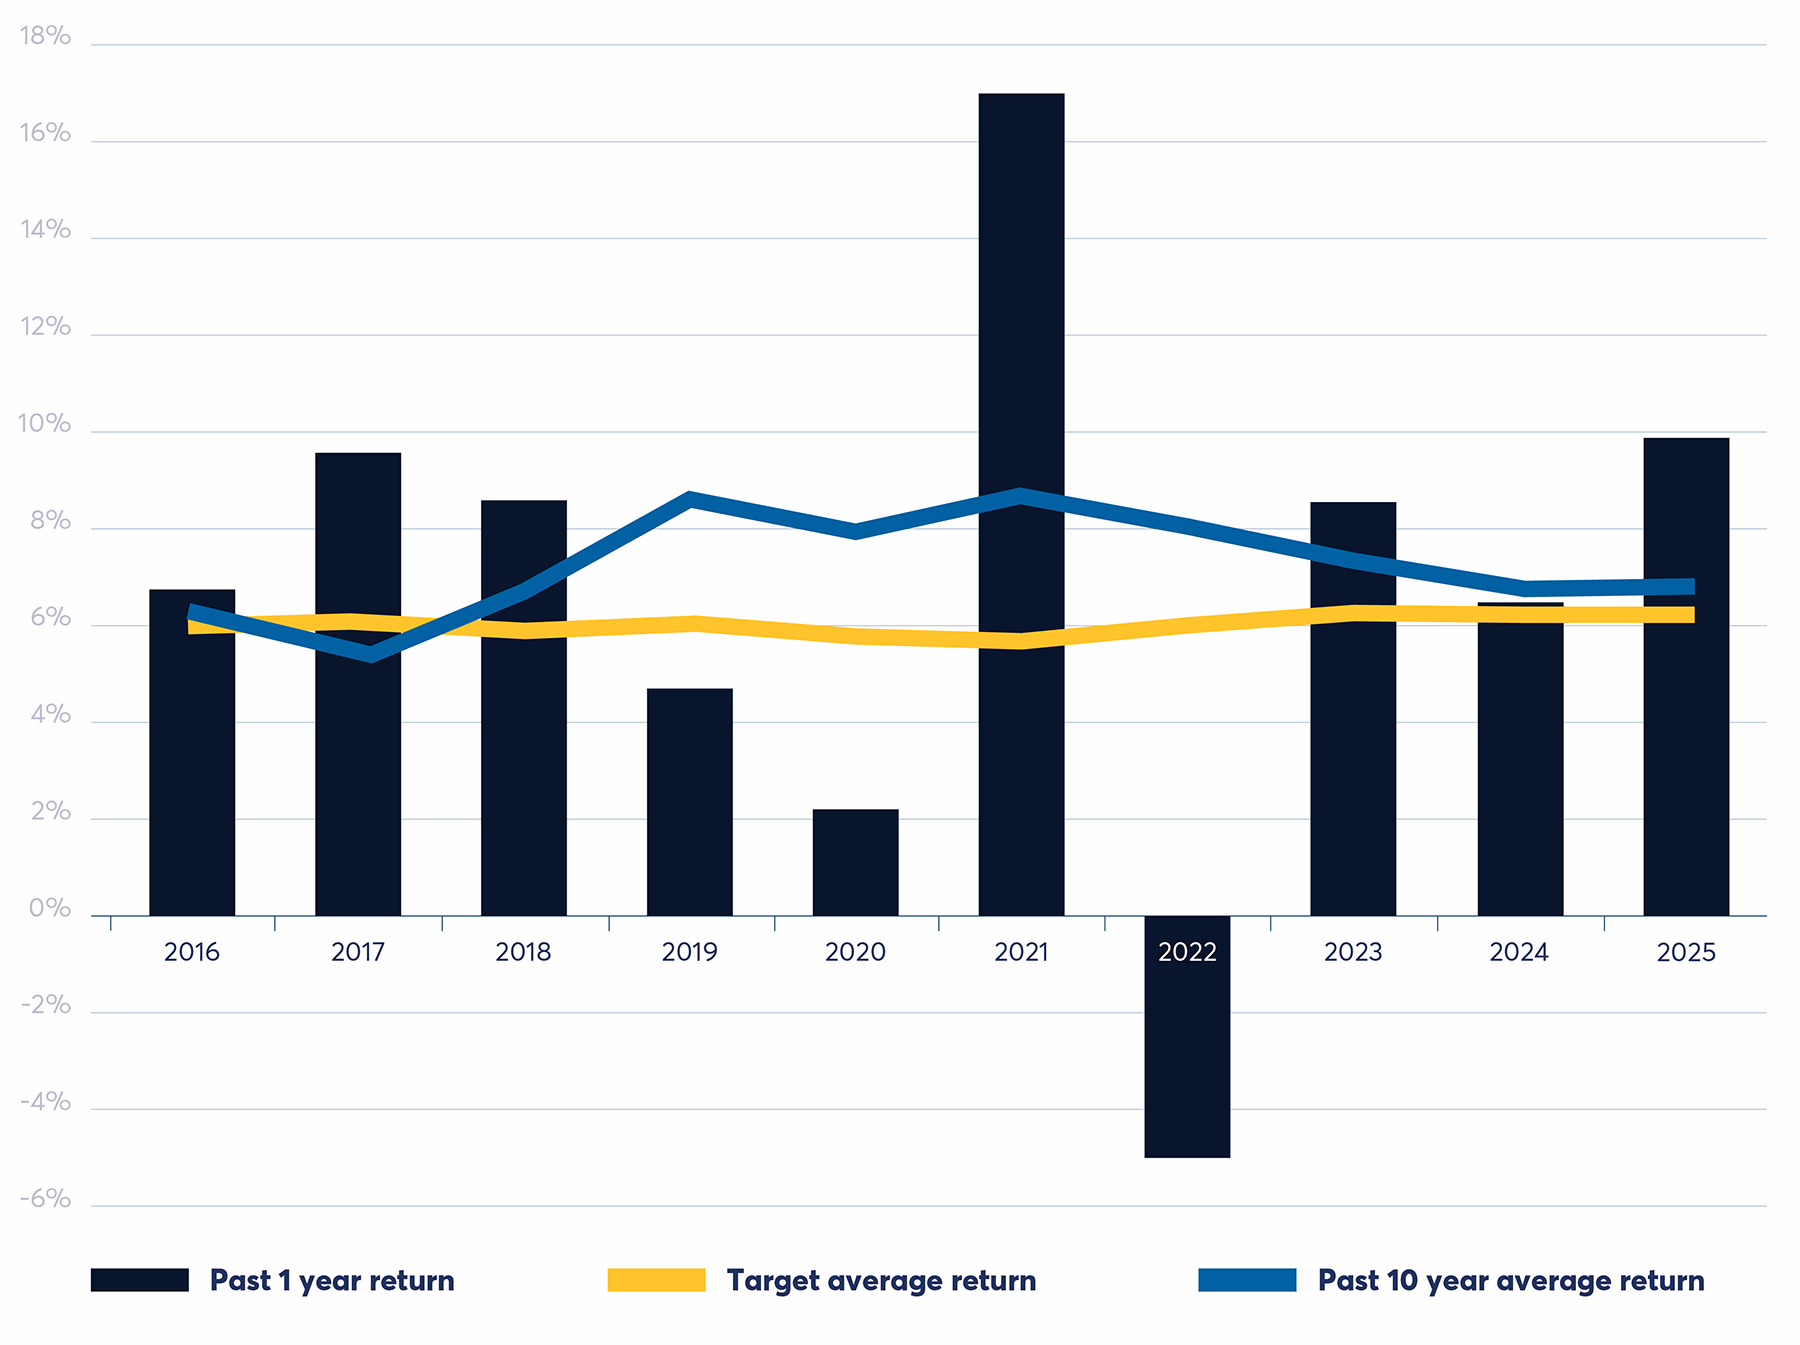
Return Target1
The return target is currently CPI2 plus 3.30% after fees and taxes.
Investment returns can go up and down over time and are not guaranteed.
Return3
The 10 year average return is 6.76% as at 30/06/2025.
Comparison between return target and returns4
Level of investment risk5
Medium to High6
Statement of fees & other costs7
$465 per year
Fees and other costs for a member with a $50,000 balance.
Members can also review the annual Member Outcomes Assessment document, which shows how BUSSQ's MySuper and choice products compare to other MySuper and choice products across areas including investment returns, level of investment risk, fees and costs.